

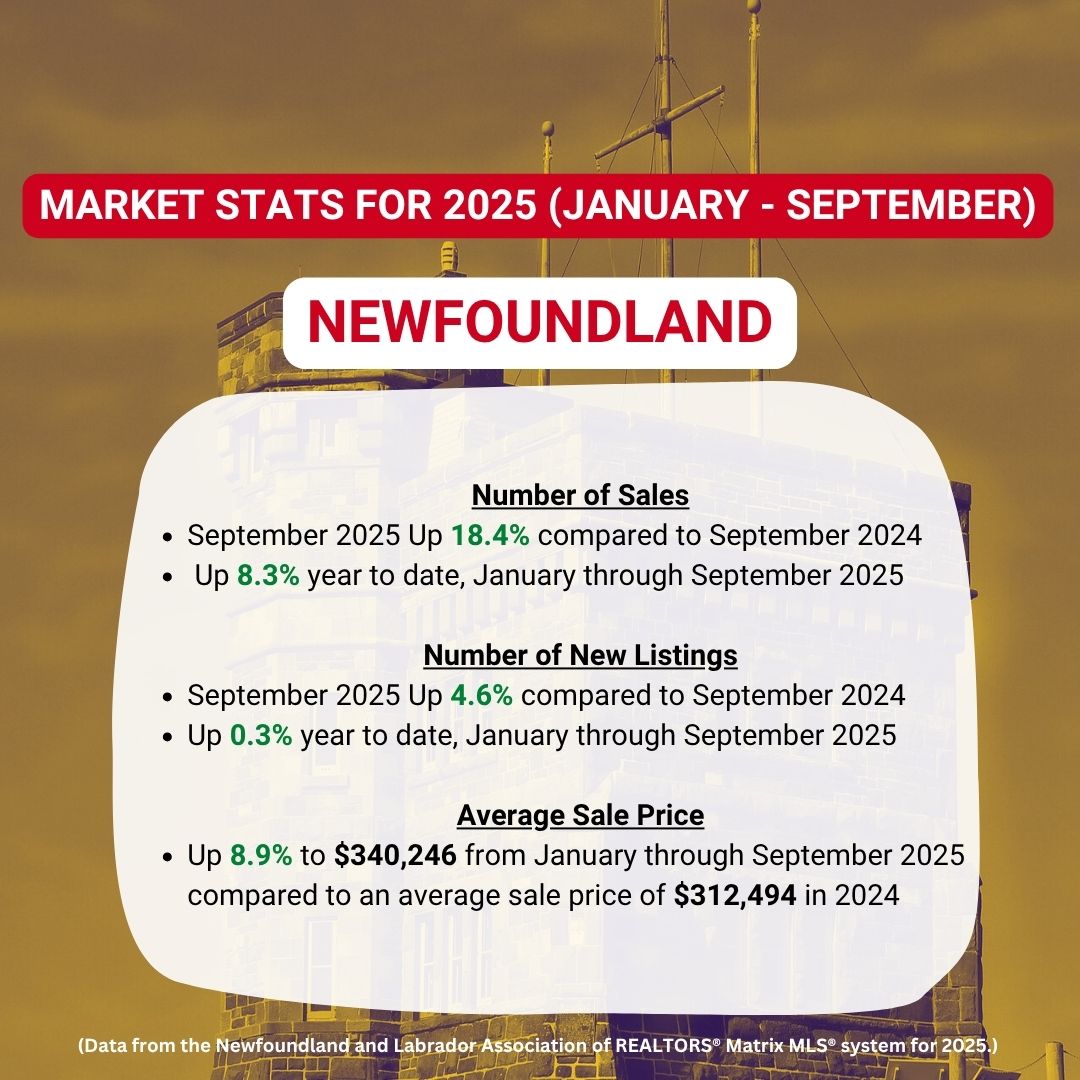
Newfoundland
🟡 The number of sales was up 18.4% compared to September 2024 and is up 8.3% year to date (January through September).
🟡 The number of new listings was up 4.6% in September compared to September 2024 and is up 0.3% year to date (January through September).
🟡 The average sale price this year (January through September) is up 8.9% to $340,246 compared to $312,494 in 2024.

St. John’s Metro
🔵 The number of sales was up 15.1% compared to September 2024 and is up 6.8% year to date (January through September).
🔵 The number of new listings was down 1.0% in September compared to September 2024 and is down 3.9% year to date (January through September).
🔵 The average sale price this year (January through September) is up 10.8% to $412,569 compared to $372,410 in 2024.
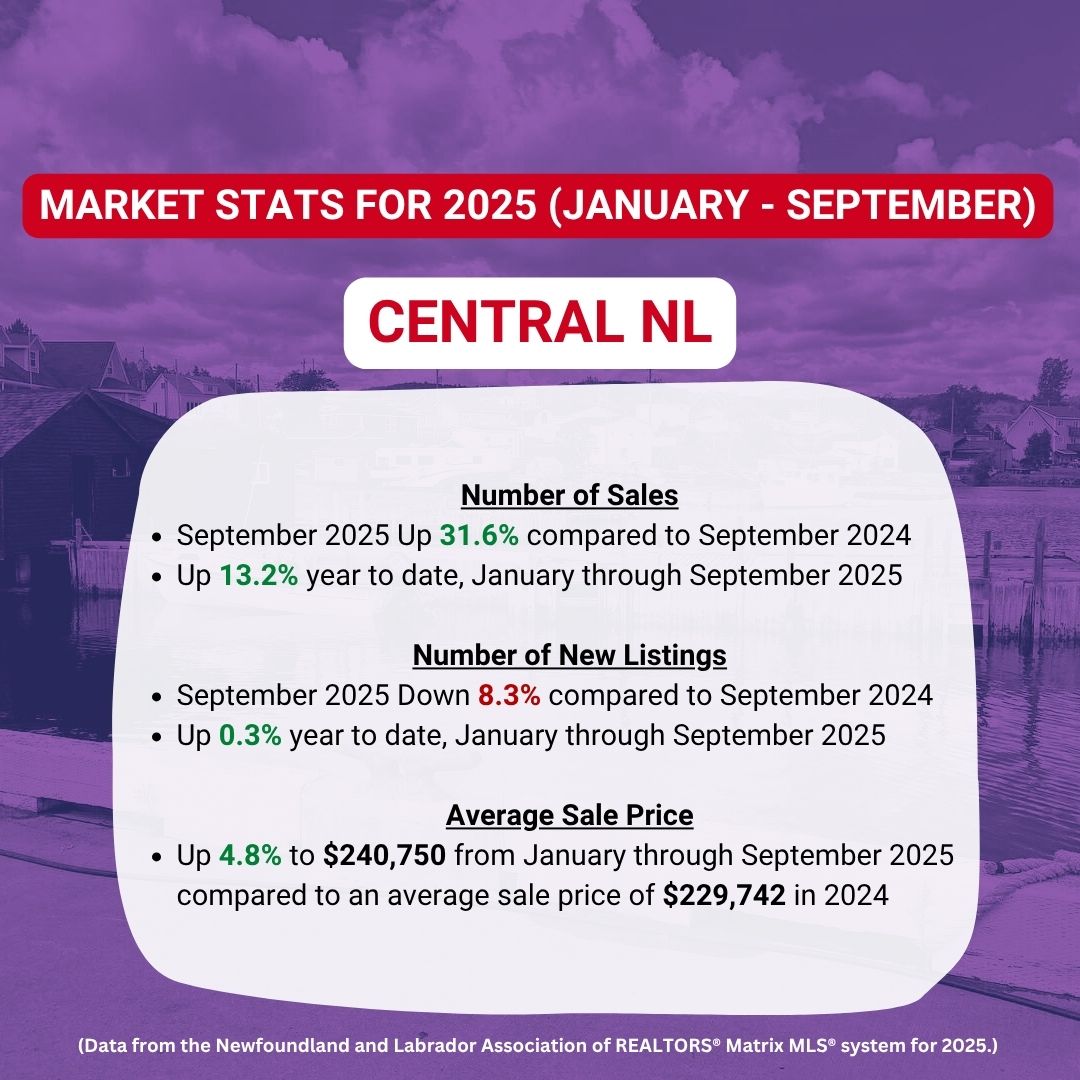
Central NL
🟣 The number of sales was up 31.6% in September compared to September 2024 and is up 13.2% year to date in 2025 compared to 2024.
🟣 The number of new listings was down 8.3% in September 2025 compared to September 2024 but is up 0.3% year to date in 2025 compared to 2024.
🟣 The average sale price this year (January through September) is up 4.8% to $240,750 compared to $229,742 in 2024.

Burin Peninsula NL
🔴 The number of sales was down 21.1% in September compared to September 2024 but is up 3.6% year to date (January through September).
🔴 The number of new listings was up 153.8% in September compared to September 2024 and is up 27.9% year to date (January through September).
🔴 The average sale price this year (January through September) is up 15.8% to $175,180 compared to $151,240 in 2024.
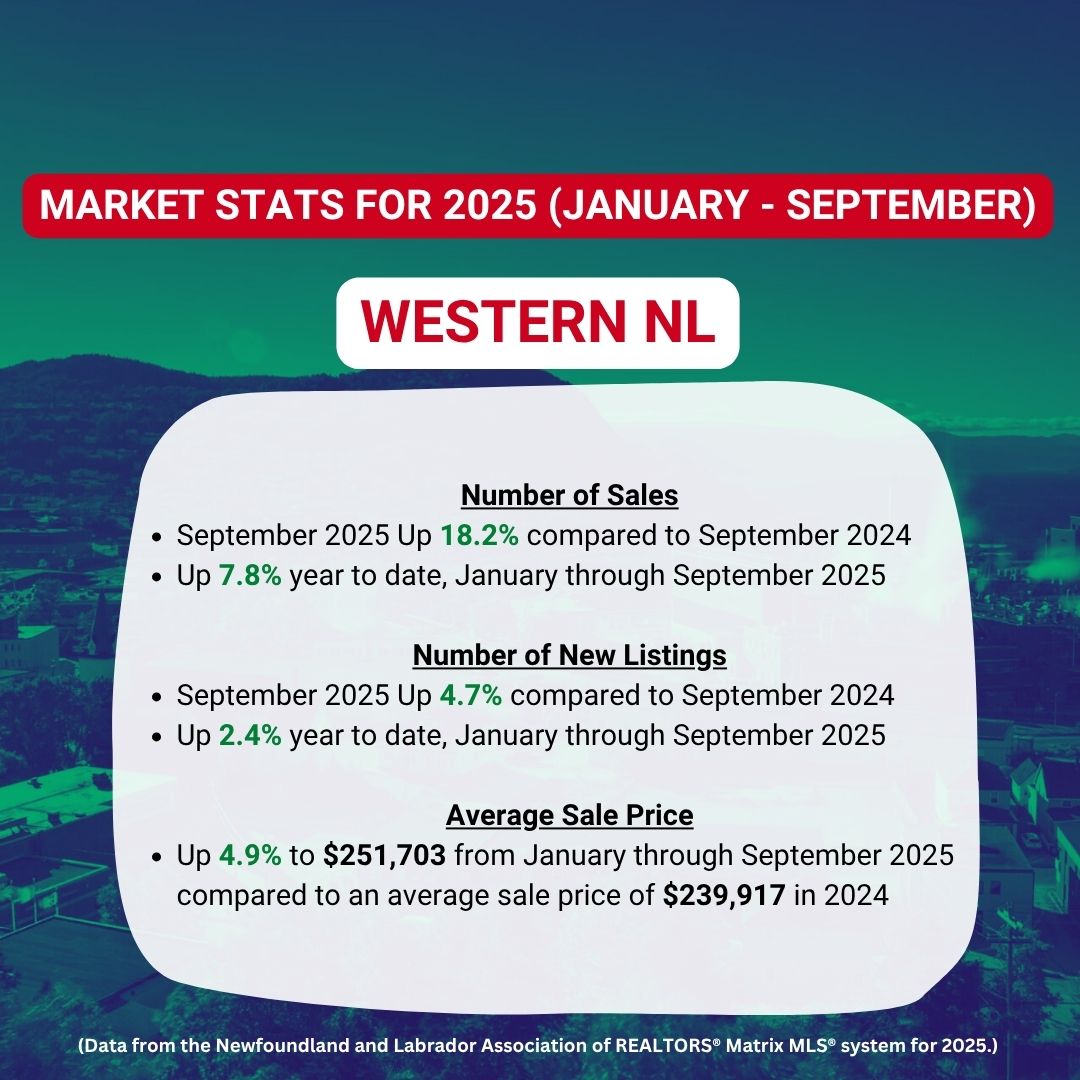
Western NL
🟢 The number of sales was up 18.2% in September compared to September 2024 and is up 7.8% year to date (January through September).
🟢 The number of new listings was up 4.7% in September compared to September 2024 and is up 2.4% year to date (January through September).
🟢 The average sale price this year (January through September) is up 4.9% to $251,703 compared to $239,917 in 2024.
(Data from the Newfoundland and Labrador Association of REALTORS® Matrix MLS® system for 2025.)
